Daily activities such as car driving, wood burning and industrial processes cause environmental pollution. This environmental stress causes around 40 deaths per day and a considerable burden of structural hospitalisations in Belgium. Availability of high-quality and high-resolution data on environmental stressors is a key requirement to be able to investigate health-environment relationships in a quantitative way. We discuss what information is available and highlight some of the current shortcomings related to the availability of data on environmental stress that are required to adequately research health-environment relationships.
The significant burden of environmental stressors
In Belgium, it is estimated that, on average, 13% of the mortality and disease burden originates from environmental stress (1). Environmental stress is therefore associated with 14,300 annual deaths (or 39 deaths per day) and 234,000 annual hospitalisations (or 641 per day). Of the estimated 13% of deaths caused by environmental stress, almost 70% originates from ambient (outdoor) air pollution. Other important environmental stressors in terms of health effects are noise stress (especially road noise), heat and cold stress, indoor air pollution, ionising radiation (nuclear/medical), exposure to chemicals (asbest, pesticides, lead, …) and a lack of green space provision.
Availability of data on environmental stressors in Belgium
To monitor the burden of environmental stressors, high quality and up-to-date exposure data are available. In the last decades, much progress has been made in making available environmental data. For example, since 2010 there exist in Belgium high-resolution air pollution maps which were not available before.
In the table below, we list some examples of relevant environmental data that are currently available.
| Stressor | Data | Source |
|---|---|---|
| Particulate Air Pollution - Particulate Matter smaller than 2.5 µm (PM2.5) | 10x10 m high resolution data on air pollution including Street configuration effects | IRCEL - CELINE https://www.irceline.be/nl/documentatie/open-data |
| Particulate Air Pollution - Black Carbon (BC) | 10x10 m high resolution data on air pollution including Street configuration effects | IRCEL - CELINE https://www.irceline.be/nl/documentatie/open-data |
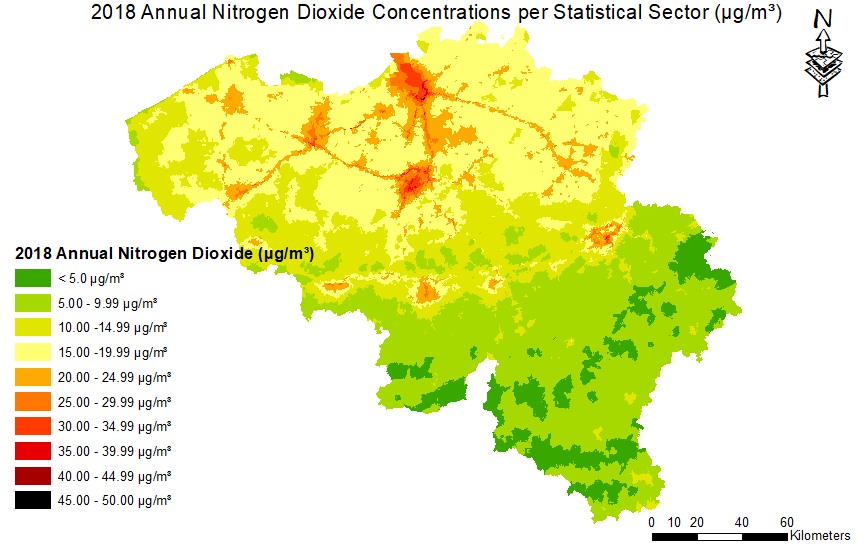
| Gaseous Air Pollution - Nitrogen Dioxide (NO2) | 10x10 m high resolution data on air pollution including Street configuration effects | IRCEL - CELINE https://www.irceline.be/nl/documentatie/open-data |
| Gaseous Air Pollution - Ozone (O3) | 10x10 m high resolution data on air pollution | IRCEL - CELINE https://www.irceline.be/nl/documentatie/open-data |
| Heat and Cold | Cold stress (e.g. mean winter temperature), heat stress (e.g. mean summer temperature, number of days with Tmean >25°c or Tmax >30°c, …), urban Heat Islands |
Klimaatportaal Vlaanderen KMI |
| Noise |
High-resolution data that cover areas with noise levels above 55 dB. Data available on road noise, railway noise, airplane noise, and for Brussels also industrial noise |
Brussels Wallonia https://www.geopunt.be/search?facet=all&q=geluid |
| Green space | NDVI data can be used as a proxy to quantify green space provision |
MODIS NDVI 250 m resolution (annual and monthly data) |
| Land cover | Data on presence of amongst other industry, agriculture, forests, … |
CORINE LAND COVER 2012 and 2018 |
| Trafficked roads | Data sets with primary and secondary roads (which are very often characterised by high amounts of traffic) |
Flanders: Geoportaal Vlaanderen Wallonia: Geoportail Wallonie Brussels: Geoportal of the Brussels capital region |
Despite great progess, data gaps remain
Despite the enormous progress of the last decades, there are currently still a number of data gaps:
- While Belgium has high-resolution air pollution models (10x10 m resolution including street configuration effects) that are among the best in the world, these models are still far from perfect and, for example, underestimate concentrations on heavily trafficked roads as the closest receptor points of the models are located 15 metres away from the road.
- Indoor air pollution is also important but very difficult to quantify on a population level as it can vary heavily between buildings, and there is a lack of statistically representative measurements.
- For lead exposure (Pb), that can have negative effects on our brains, there is a lack of quantification of such exposure. Large-scale statistical representative biomonitoring has the potential to deliver reliable results for lead exposure, but of course, such measurements would require huge investments of resources to conduct. The same is true for other chemicals, such as pesticides, asbestos, mercury.
Contributions of the ELLIS project
The ELLIS project aims to quantify the relationship between environmental stressors and health outcomes and socio-economic inequalities. The project will therefore valorise existing data on environmental stressors. Specifically, ELLIS will develop harmonized methodologies for obtaining environmental stressor data at the level of the statistical sector, and make these results available for reuse. ELLIS will also use the available environmental stressor data to identify hotspots and quantify environmental burden of disease.


